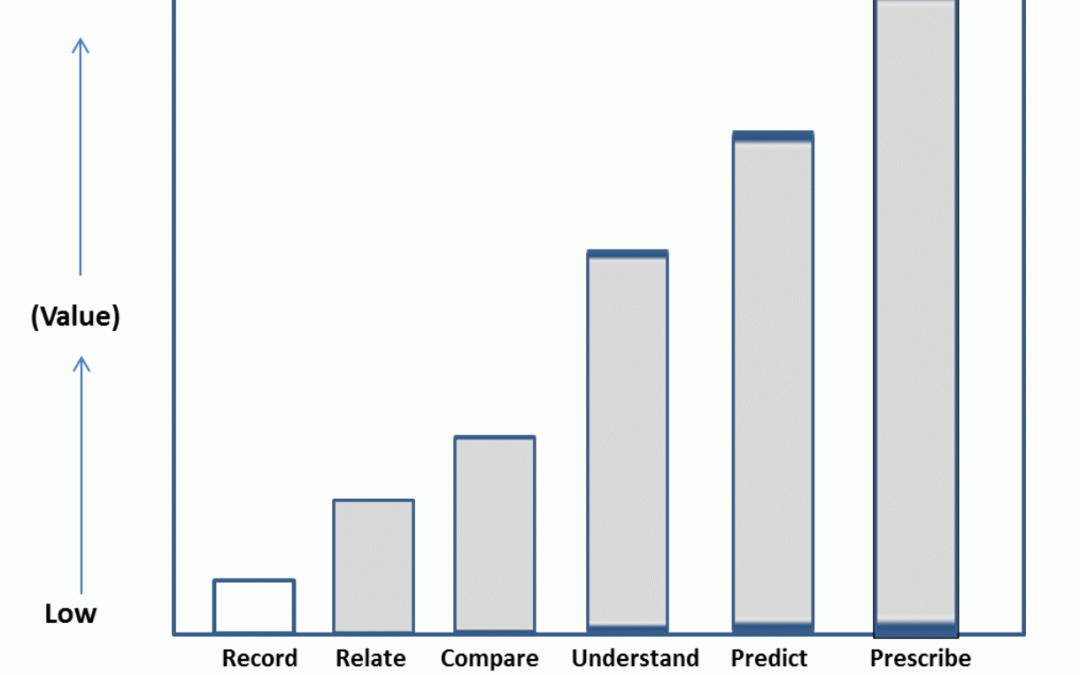
Human capital measurement and analytics is a communications tool. It brings together disparate sources such as surveys and operations of different units or levels to paint a cohesive actionable picture of current conditions and likely futures. As in most cases human capital measurement began with simply recording inputs and outputs of the workforce. This is the province of accounting. Accountants monitor income and expense to tell management what ensued as a result of past decisions and investments. HCM takes us beyond that. It positions management with a view of tomorrow.
First Steps
There are five ways to measure anything in business. They are cost, time, quantity, quality, and human reaction. The central question is, which is most important to track? The answer is, it depends. If we accept that measurement is an activity and activity is expense, it follows that we don’t want to waste our time on metrics of little value. Value comes from knowledge of things that matter. What matters is a business question, not an HR question: what matters at what points in time and for what organizational purpose?
These can be broken down into the Six Steps of Analytics.
- Step 1: Recording our work (i.e., hiring, paying, training, engaging, and retaining).
If we learn through measurement how efficient our processes are, we can improve them, thus creating value for the organization indirectly by saving money or time, or by increasing the ratio of output to input, or by making an employee or customer happier as the result of a less intrusive process or a better faster result. - Step 2: Relating to our organization’s goals (i.e., quality, innovation, productivity, service [QIPS]).
QIPS encompasses the fundamental goals of any organization. Targets are set periodically by senior management across these process outcomes and are reviewed on a regular basis. We want to link the results of our work to the impact on QIPS goals. This shows there is value in our work. - Step 3: Comparing our results to others (i.e., benchmarking).
To be effective, benchmarking requires knowledge of the organizations to which we are comparing ourselves. Broad data about a comparative group in an industry or region has only marginal value because of the great variance within that population. The more detail we can find, the more valuable are the benchmarks. - Step 4: Understanding past behavior and outcomes (i.e., descriptive analytics).
This is the first level of true analysis. It looks for and describes relationships among data without giving meaning to the patterns. It is exploratory and illustrative rather than predictive. From it, we begin to see trends from the past. Yet, it is very risky to extrapolate the past into the future in the volatile, rapidly changing markets of the 21st Century. - Step 5: Predicting future likelihoods (i.e., predictive analytics).
This form of analysis relates what we know to what we don’t know. It compares what happened yesterday to what will probably happen tomorrow. Predictive analytics ascribes meaning to the patterns observed in descriptive analysis. Banks use this to predict the creditworthiness of borrowers. Insurers use it to predict patterns of illness and mortality. Human resources can apply it to decisions about the expected return on human capital investments in hiring, training, and engaging. - Step 6: Influencing future outcomes (i.e., prescriptive analytics)
The last step is prescriptive analysis. This is a process of determining which actions will turn future outcomes in our favor. I’ll describe it in a future piece.
Ascending Value
As we move from understanding the efficiency of our processes to being able to predict and influence organizational outcomes resulting from a given human capital investment, we ascend the value ladder.


Recent Comments